Tracking migraines over time.
Migraines are notoriously hard to understand from the inside. Patterns are often delayed, multi-factor, and nearly impossible to spot without a record to look back at. This is what consistent tracking can reveal.
Sarah has had migraines for three years.
She gets them maybe twice a month. Some months more. She's never been able to figure out what causes them — she's tried cutting out red wine, stopping chocolate, sleeping more — and sometimes it seems to help and sometimes it doesn't.
She has a neurology appointment in six weeks. She wants to bring something useful. Not a rough verbal summary of how the last few months went — an actual record. Something she can point to.
She downloads Best Life and starts a Migraine Tracking program. She doesn't expect to find answers in week one. She just wants to stop going into appointments empty-handed.
Migraine patterns are complex and often multi-factor. Tracking won't give you a definitive answer about what causes yours. What it can do is help you and your care team see what's consistently present before your bad days — and that's a different kind of useful.
She started with the things she already noticed and added a few she'd never thought to log before.
Environmental data is pulled automatically — no extra logging needed.
Nothing dramatic. That's normal.
The first week, she logs every day. There's no migraine until day five — a bad one, starting around 2pm. She notes it in the app: severity 8, right temple, lasted about five hours. She took ibuprofen at hour two and it helped some. Sleep the night before was poor (about five hours). She'd skipped lunch. Work had been stressful for three days straight.
She also has a mild headache on day seven that doesn't become a full migraine. She logs it anyway. That kind of entry — a near-miss — turns out to be useful later.
At the end of week one, there's nothing to conclude. One migraine isn't a pattern. But the log is building. She keeps going.
Sarah misses two days in week two — she forgets on a busy Tuesday, and logs late on a Thursday. That's fine. Incomplete data is still data. The pattern detection in Best Life works from what's there, not from perfection.
Patterns that weren't visible day to day.
By weeks three to five, the log had enough in it to start showing her things she genuinely hadn't seen before. Not answers. Starting points.
The worst days weren't random.
Looking back at her log, Sarah noticed that several of her most severe migraines came on a Wednesday or Thursday — not Monday or Tuesday, even when Monday had been her most stressful day. She didn't know what to make of it yet, but it was the first time she'd seen a day-of-week pattern.
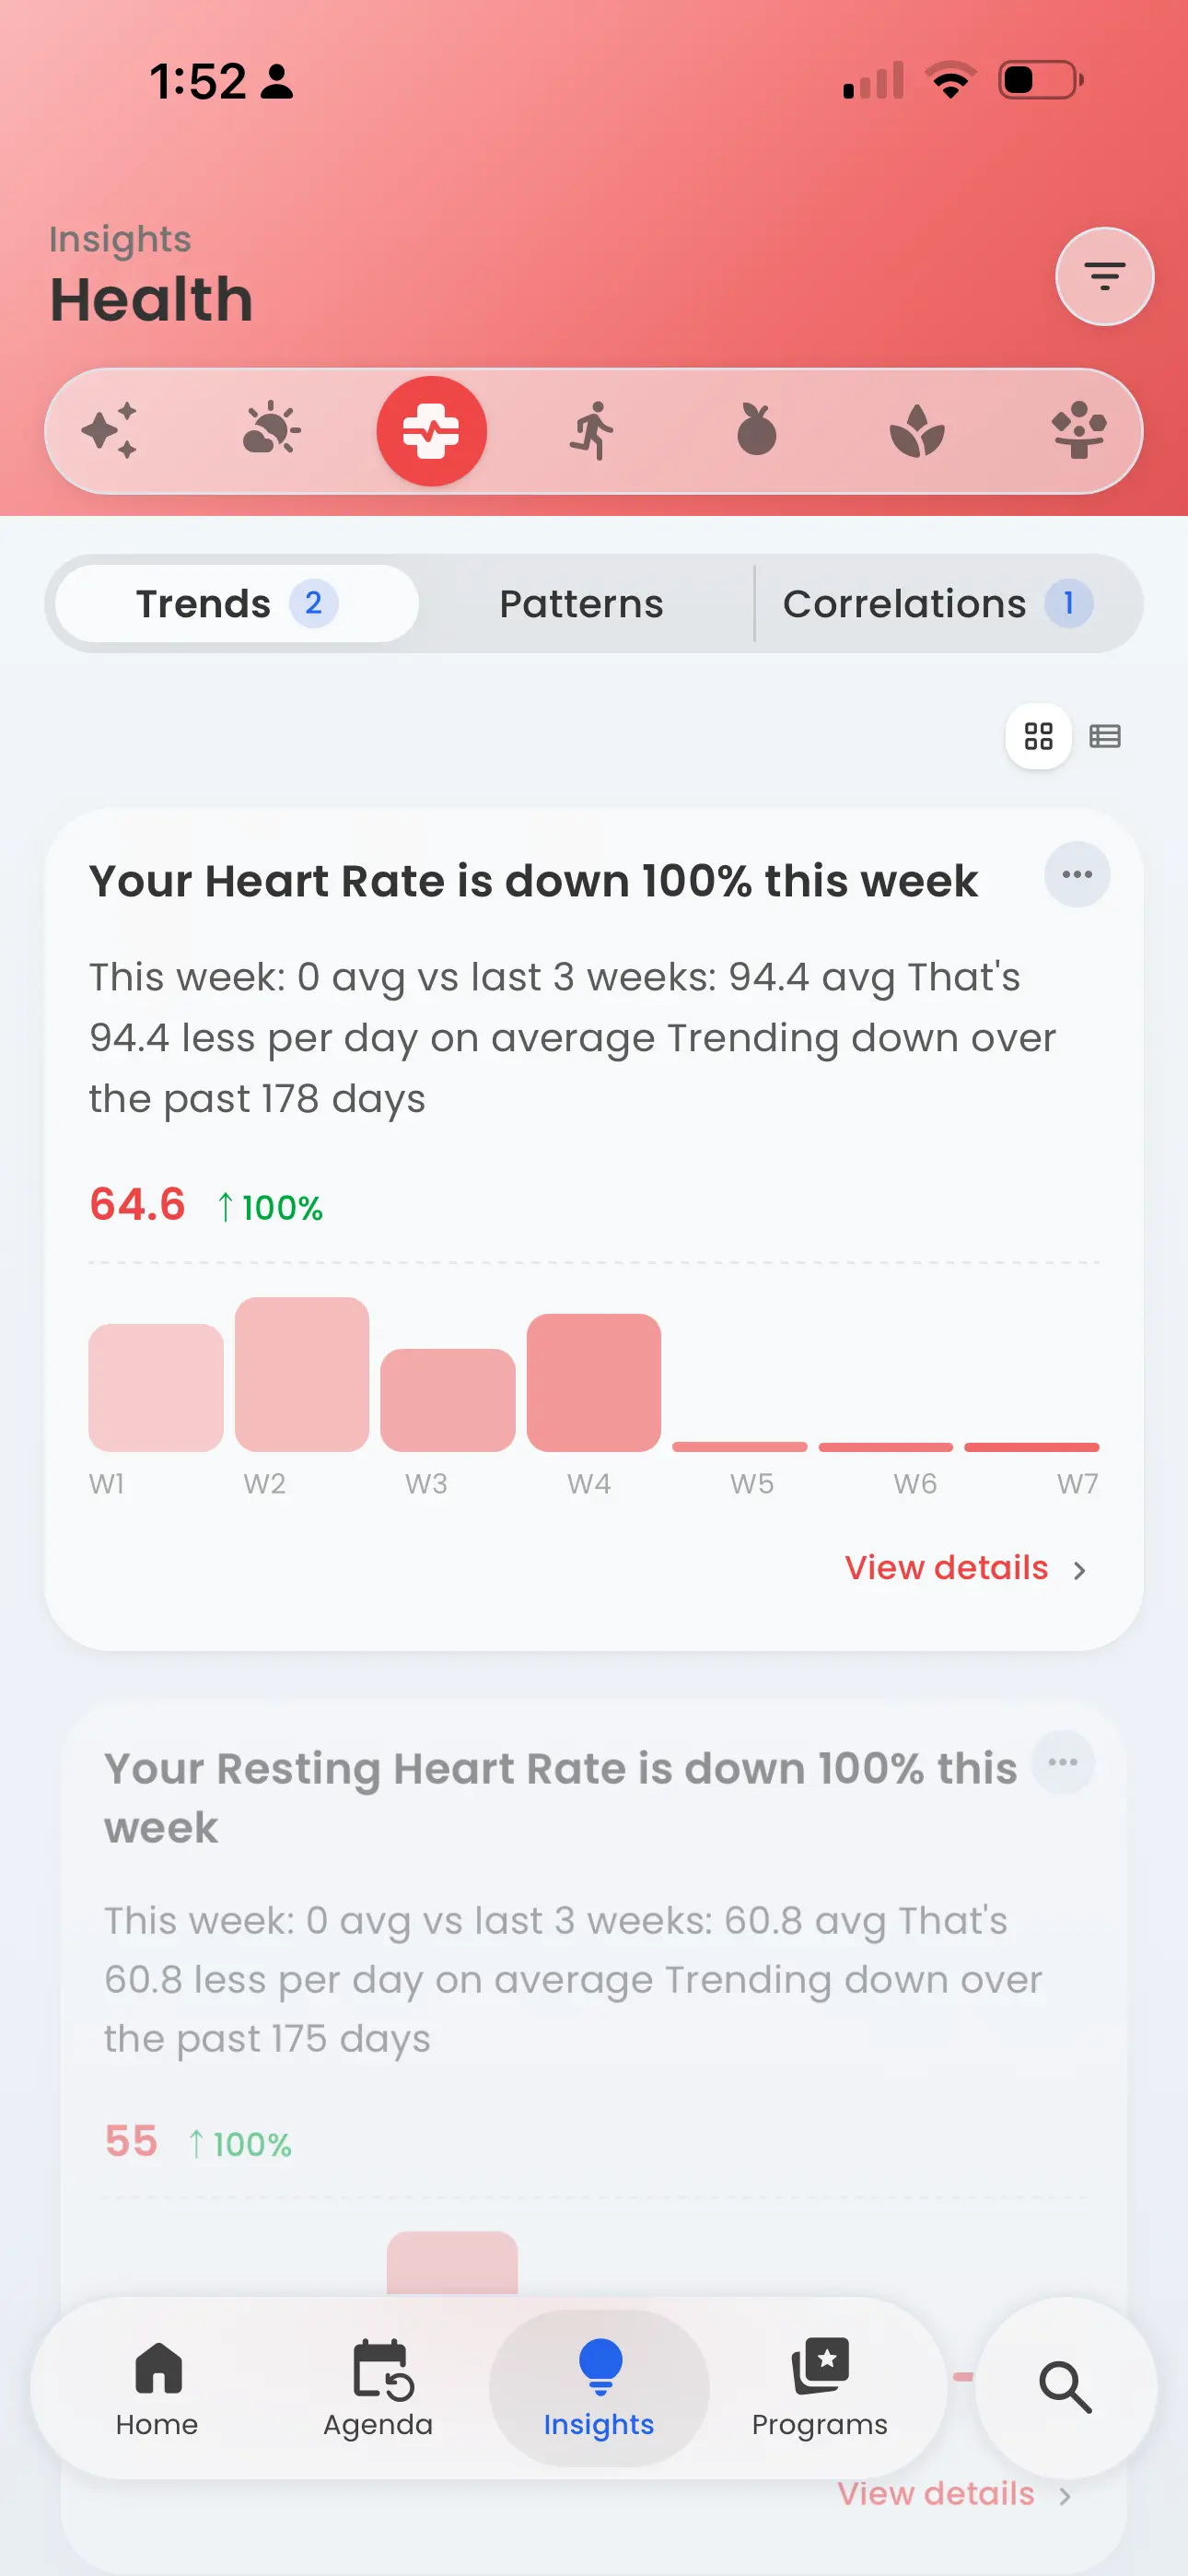
The weeks laid out side by side. The pattern was there; she just couldn't see it until it was visible.
She hadn't known barometric pressure was a thing.
Best Life automatically logs environmental conditions alongside her daily entries. When she looked at the weeks with the most migraine activity, there was a barometric pressure drop before most of them. She'd never tracked this before — she couldn't have without the automatic enrichment — but the correlation was consistent enough to be worth paying attention to.
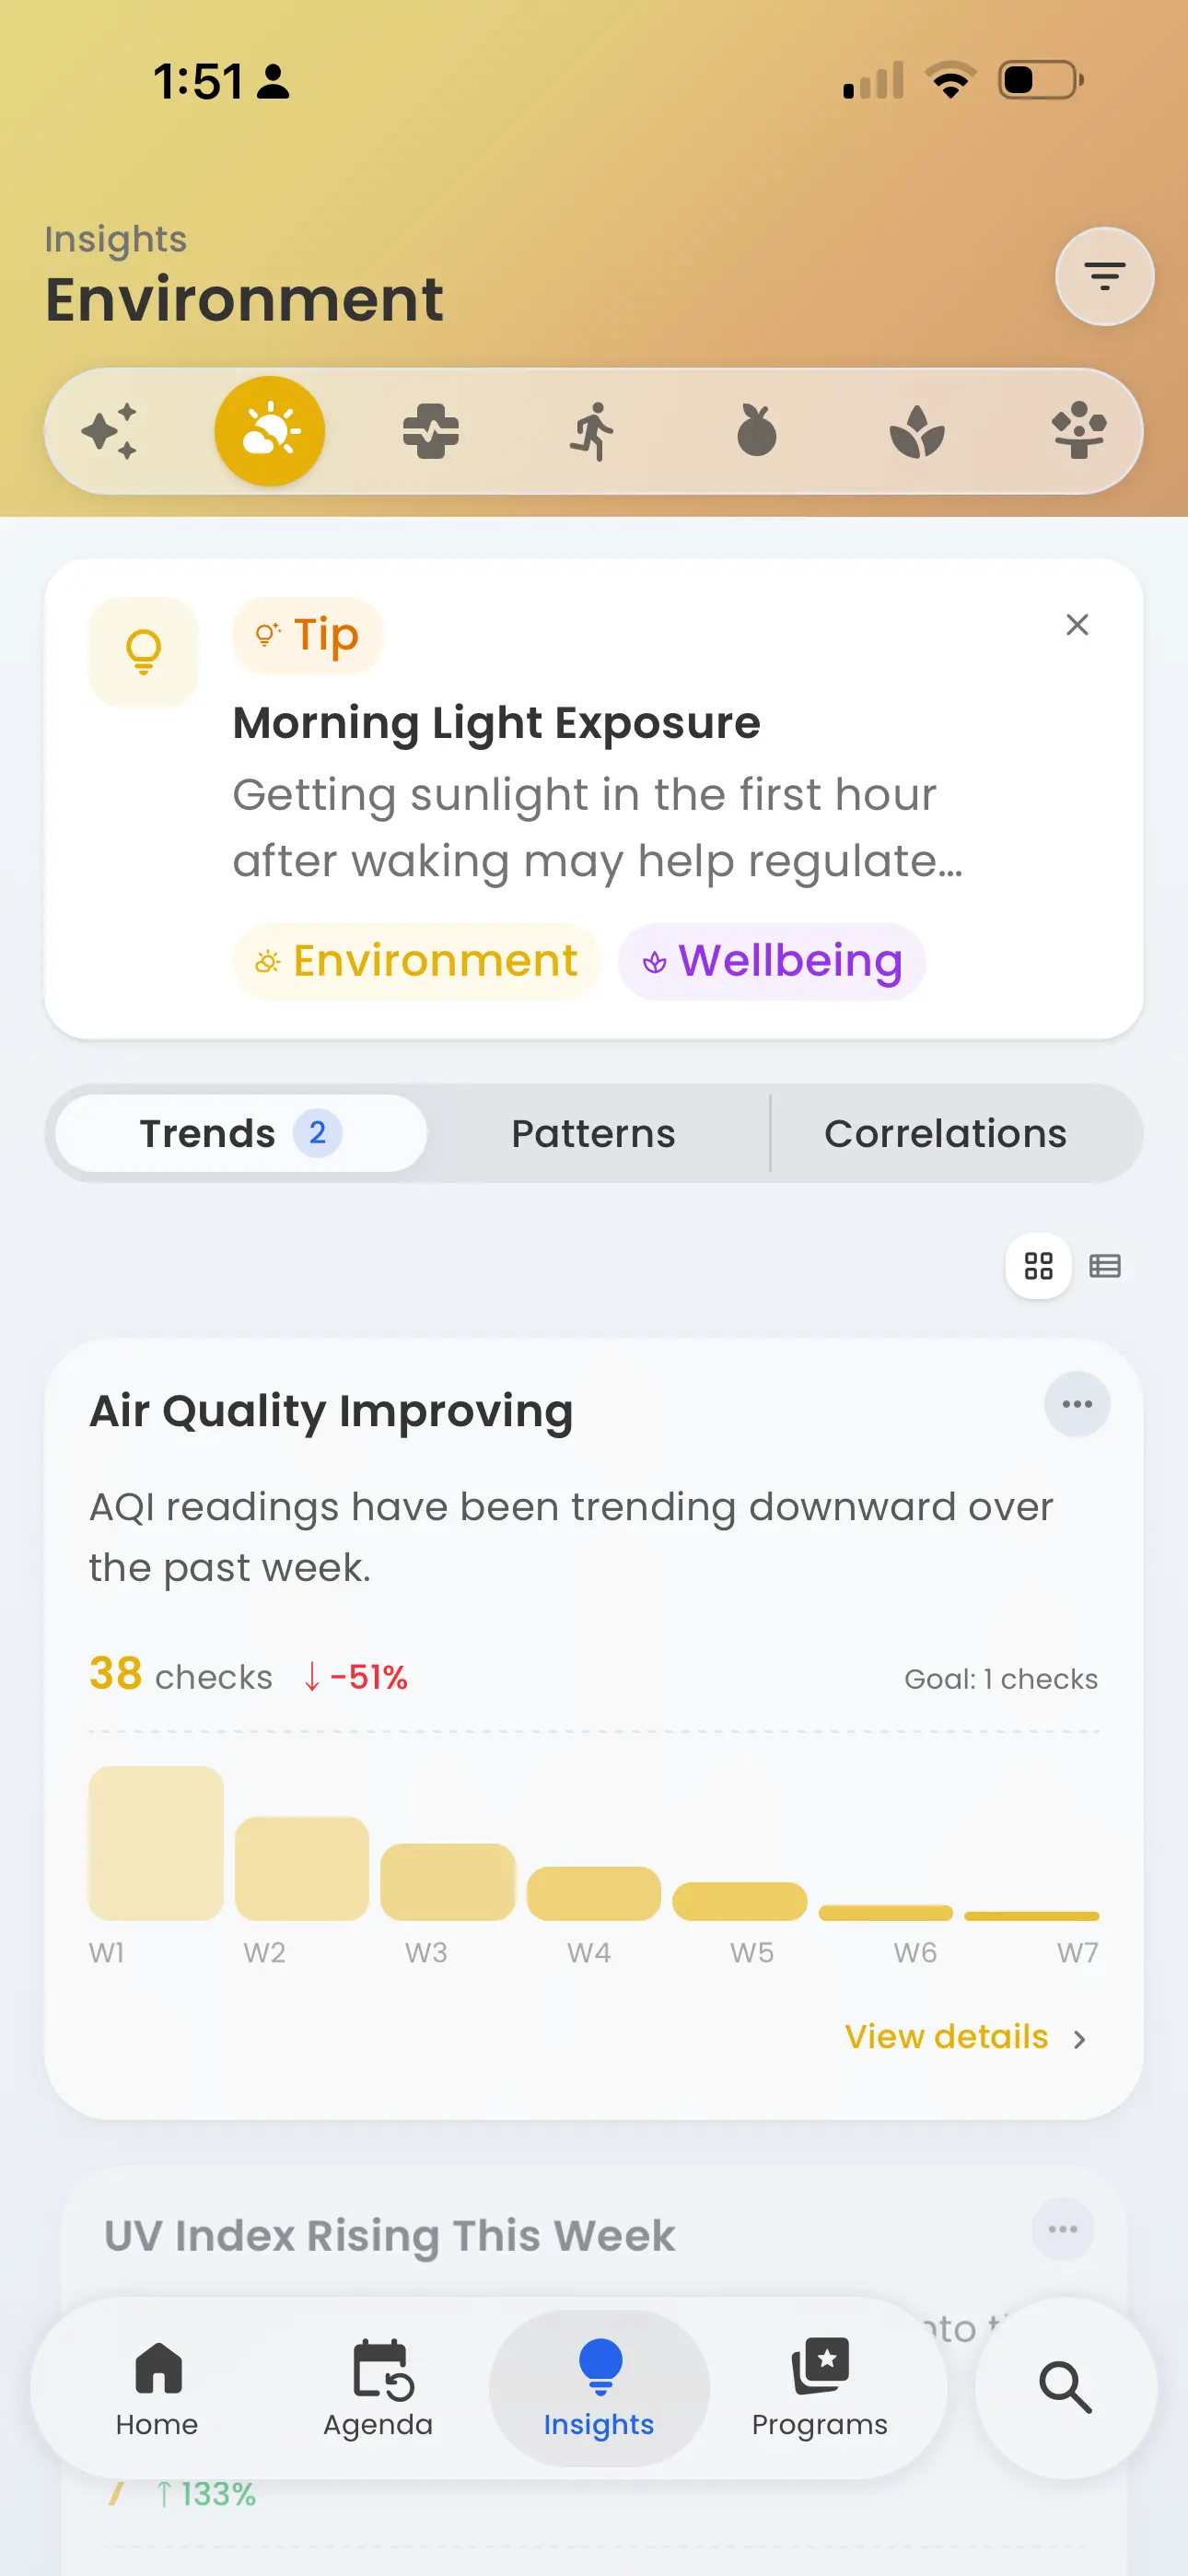
This wasn't a feature she turned on. The app was already watching.
Her Saturday mornings kept showing up.
She drinks coffee every weekday morning. On Saturdays, she usually skips it or delays it by a few hours. Looking at her log, five of her weekend migraines followed a Saturday morning with no caffeine before noon. It wasn't conclusive, but it was specific enough that she decided to try keeping the Saturday morning coffee consistent for a month and see what happened.
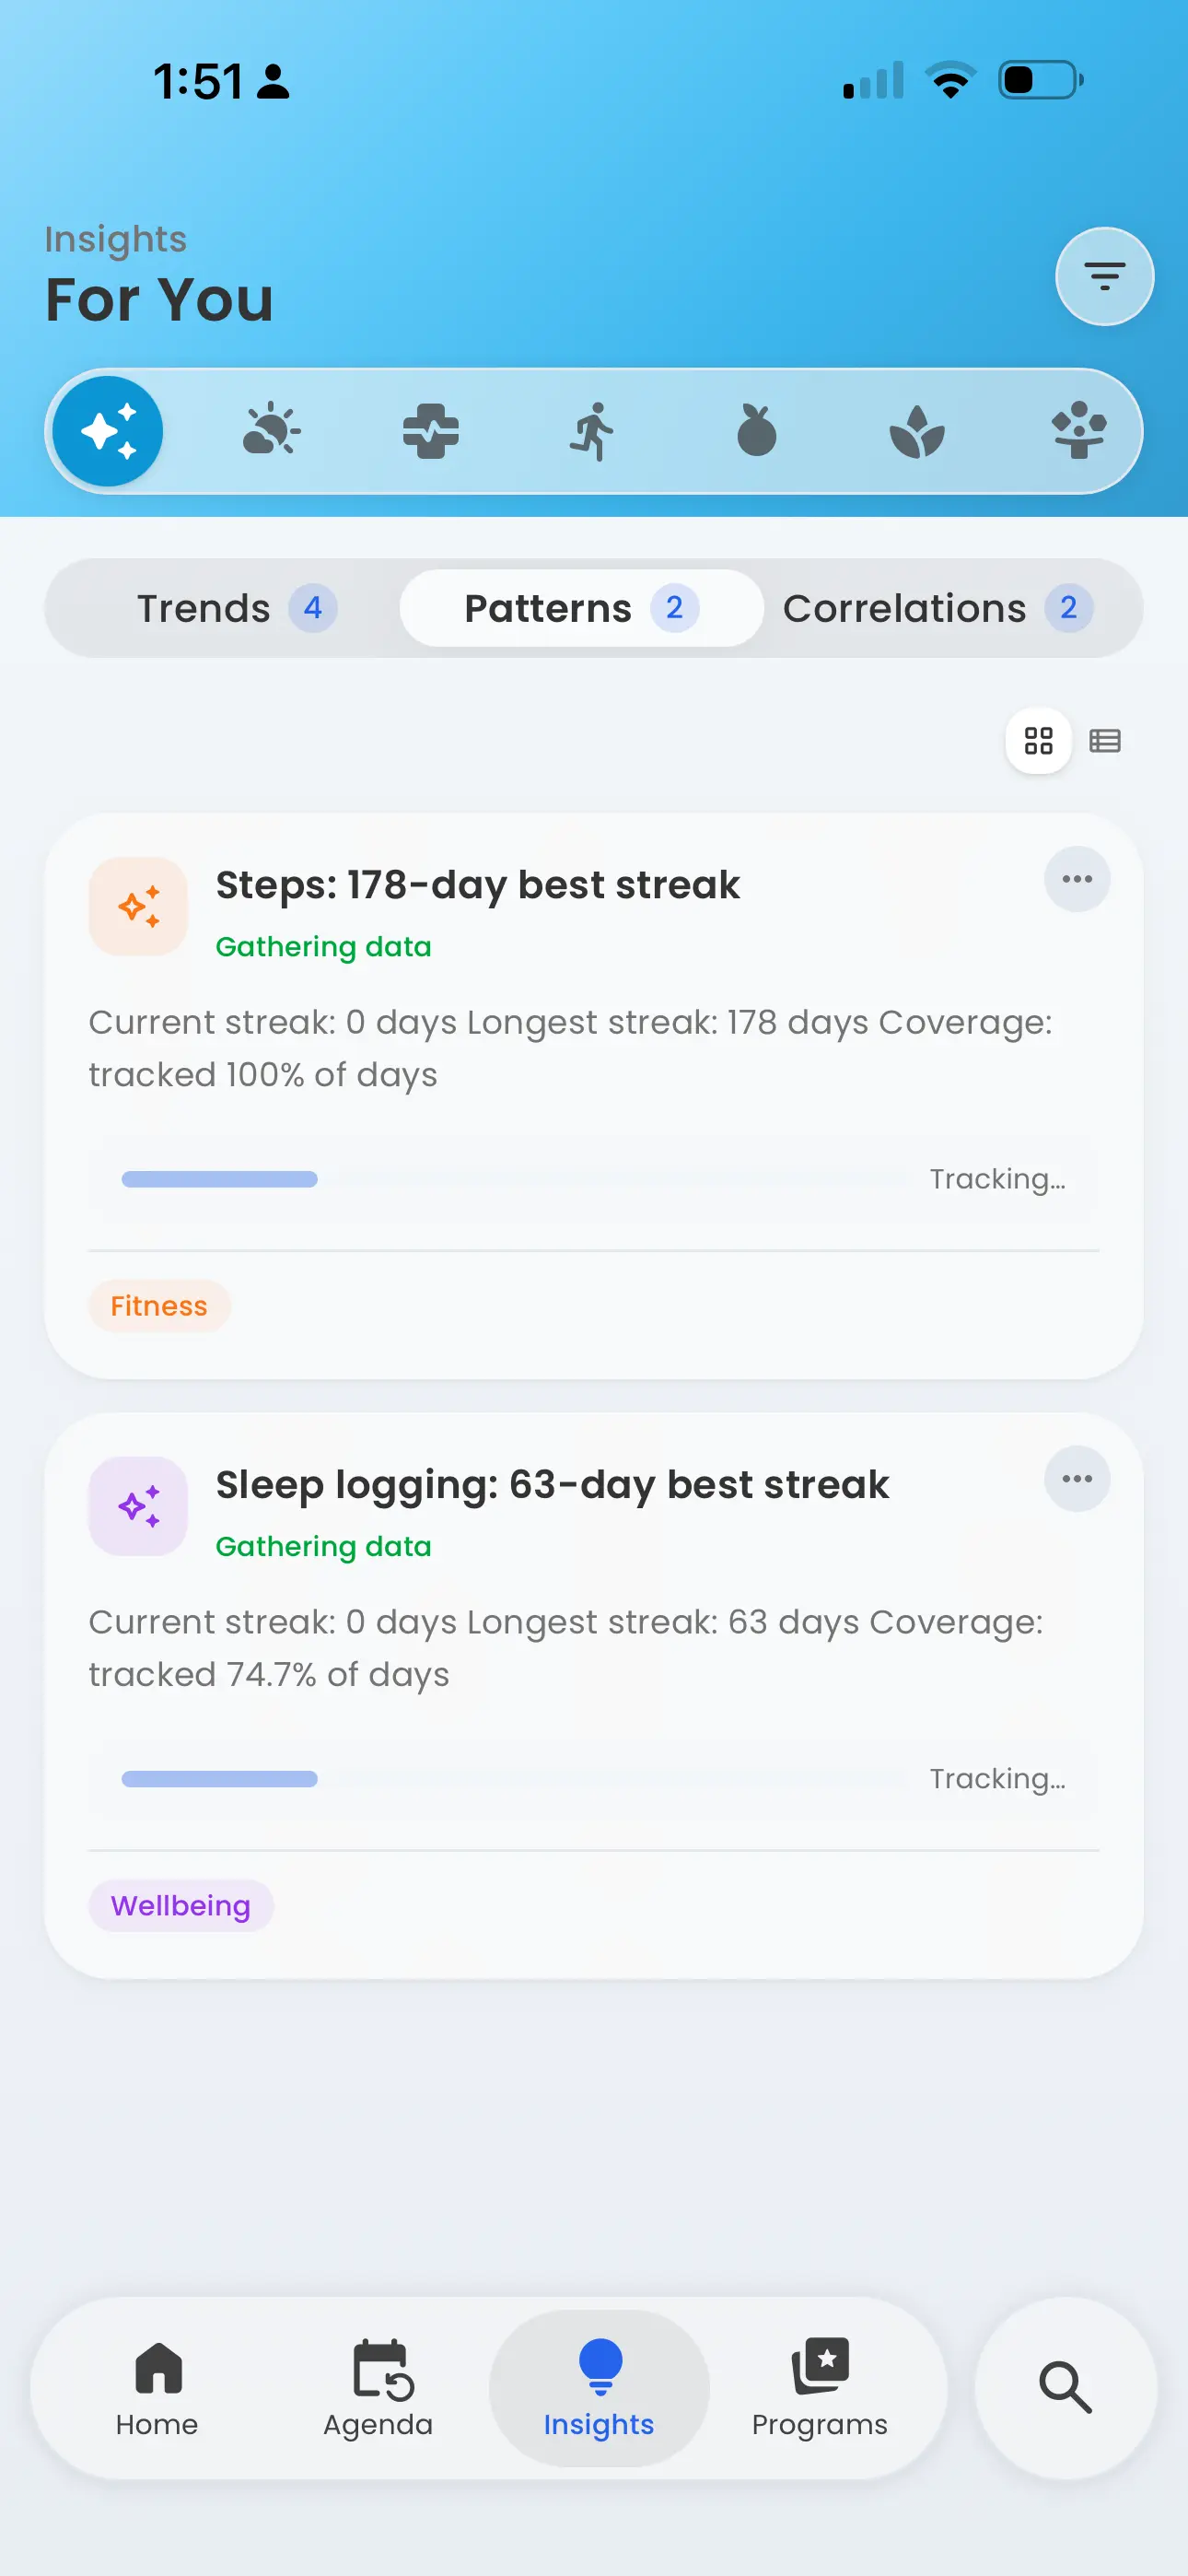
The routines she kept, and the ones she didn't.
Poor sleep appeared — but not always the night before.
She'd assumed that a bad night's sleep would cause a migraine the next day. Sometimes it did. But more often the bad nights showed up two days before. The delay made the connection nearly invisible without a log to look back at — it's exactly the kind of pattern that disappears in daily experience but surfaces in longitudinal data.
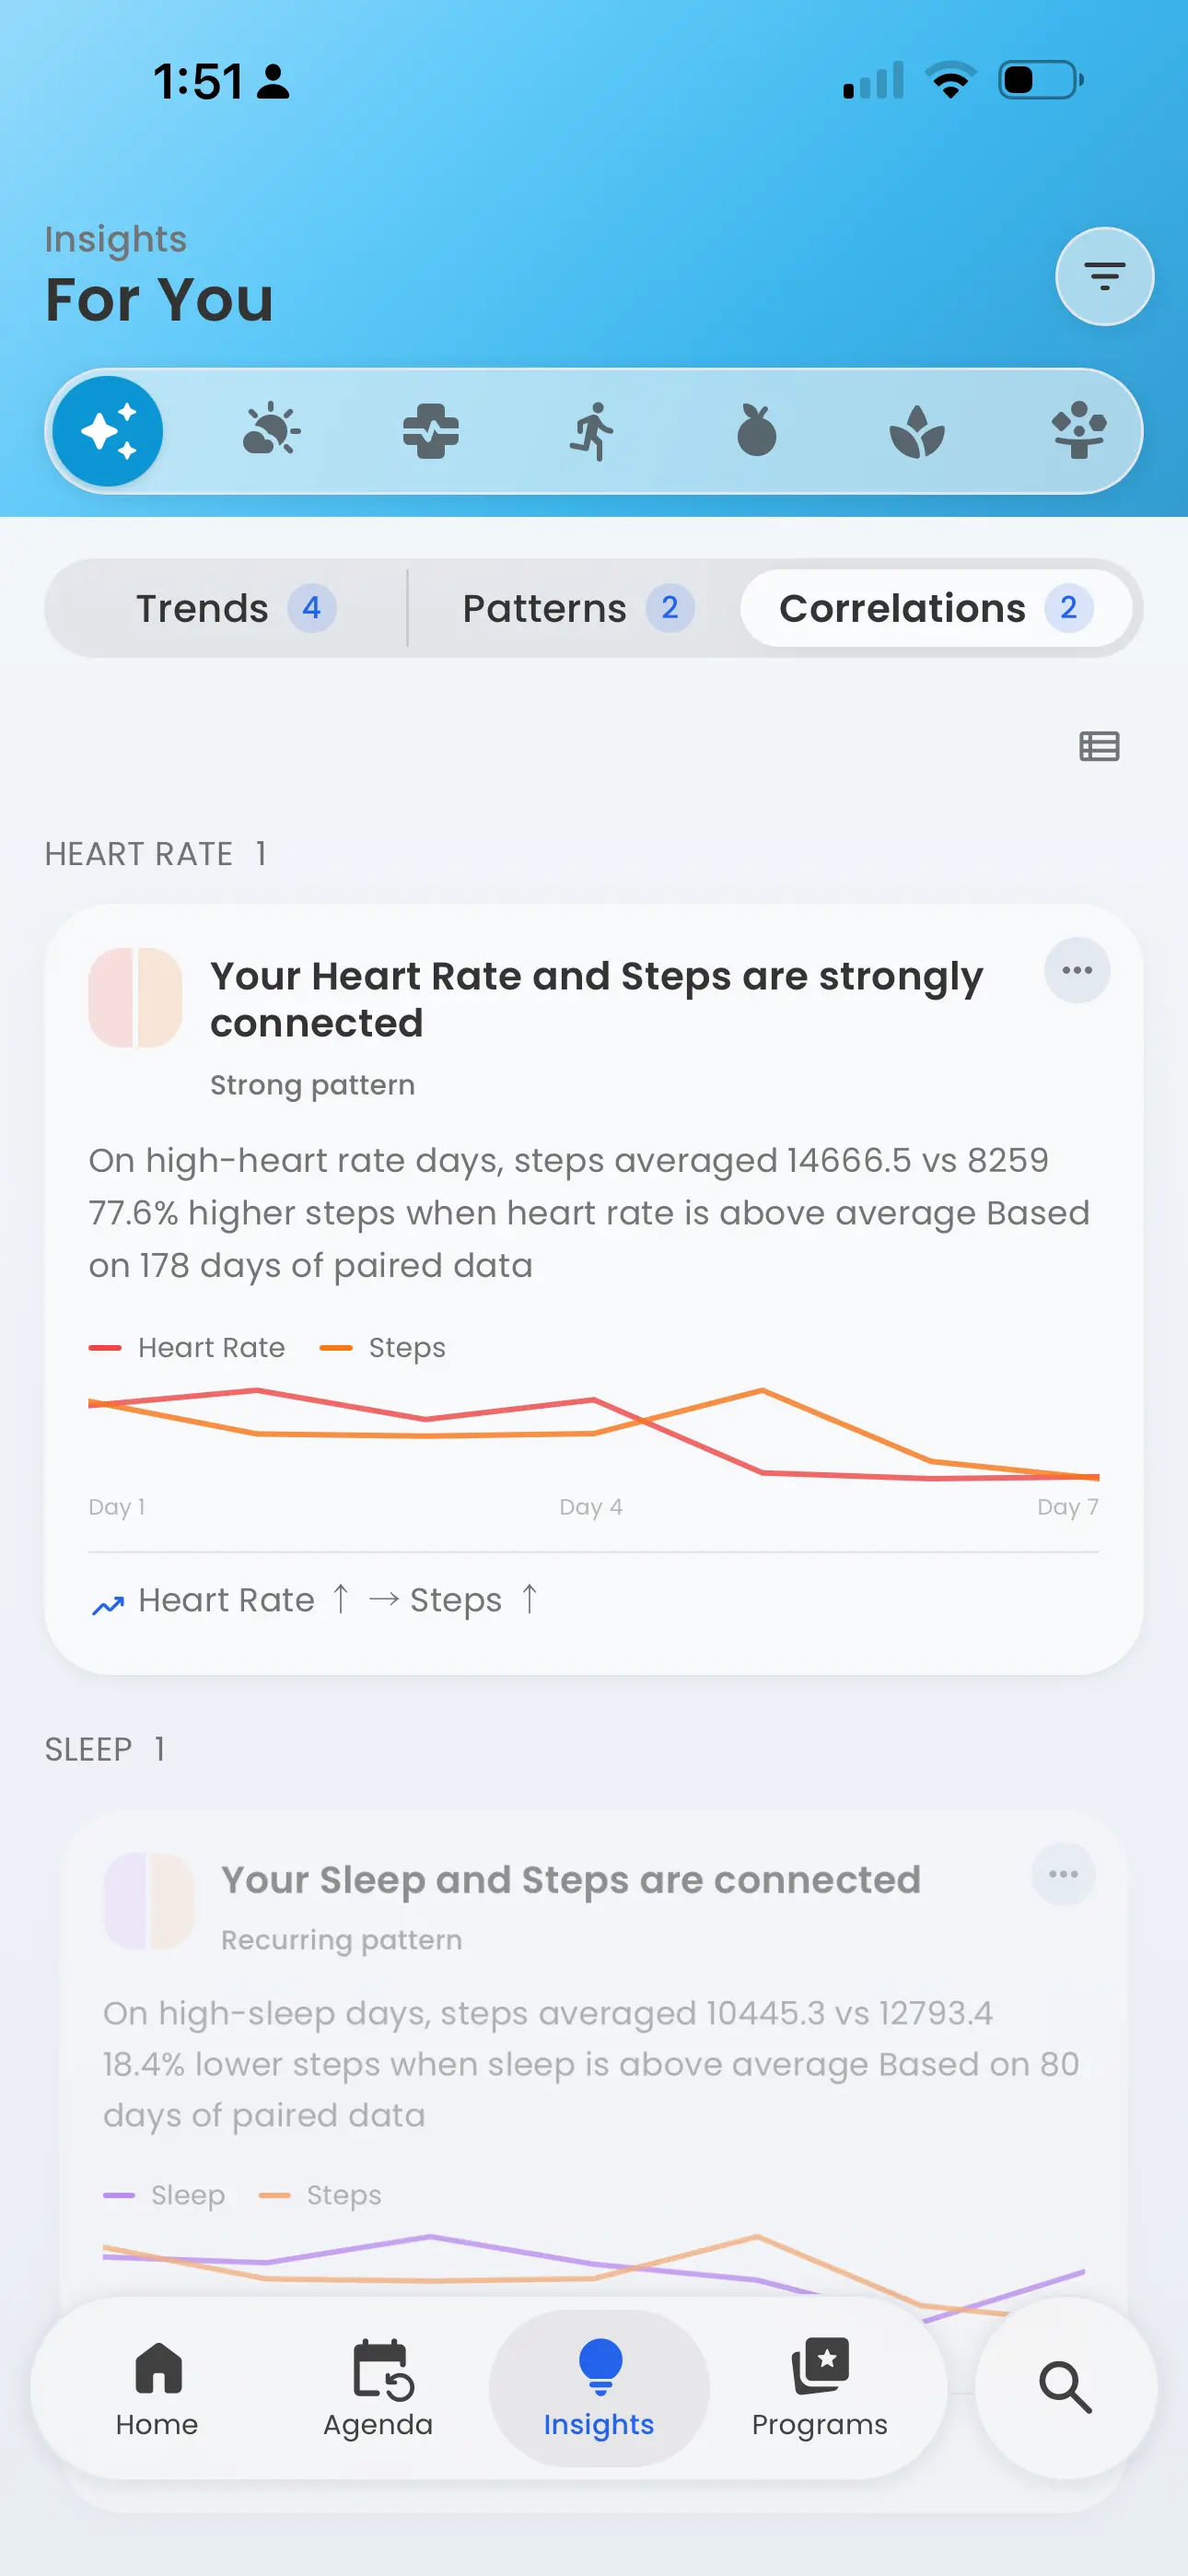
Some patterns only show up when you line two things up next to each other.
Organizing what she couldn't hold in her head.
The tracking alone wouldn't have been enough. The connections emerged because Best Life kept everything in one place and surfaced what the data suggested — without asking her to do the analysis herself.
Automatic environmental data
She never would have logged barometric pressure manually. Best Life pulled it in automatically from her location every day — which meant it was there when the pattern surfaced, without any extra effort on her part.
Delayed pattern detection
The two-day lag between poor sleep and migraines is the kind of connection that's nearly impossible to spot on your own. Best Life looks across the full log, not just yesterday — so delayed correlations become visible.
A record for her appointment
She went to her neurology appointment with five weeks of logged data, a summary of her migraine frequency, and two potential patterns worth discussing. That's a different conversation than "I've had a rough few months."
What this kind of tracking is actually good for.
Migraine tracking is a long game. A month of data tells you more than a week, and six months tells you more than one. That's not a reason to wait — it's a reason to start now, even imperfectly, so the data has time to build.
What Best Life can do is give you a clearer picture of what's consistently present before your bad days — so you and your care team have something real to work with. What it can't do is tell you definitively what causes your migraines, or whether any change you make will work. That's not the app's job. The app's job is to help you stop carrying all of this in your head alone.
For Sarah, the most useful outcome wasn't a confirmed trigger list. It was walking into her appointment feeling like she understood her own situation well enough to have a real conversation about it.
If you want to start tracking migraines, the Migraine Tracking program in Best Life has templates, plans, and insights already configured for this use case. You can start with the defaults and adjust from there.